 gbChartMaster
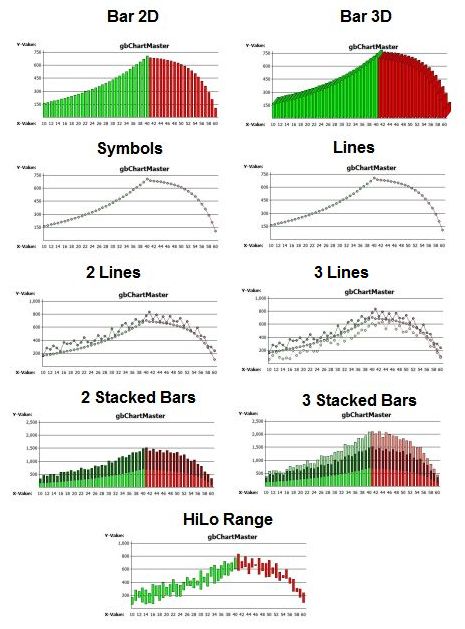
 gbChartMaster generates a variety of charts - bar charts (2D and 3D), stacked
bar charts, line charts, multi-line charts, points/symbols only and a hi-lo bar
chart. Control over all aspects of the graph elements - position, color, fonts, margins,
grid, and more - is provided. Images for background and for annotation stamps are also
supported.
gbChartMaster generates a variety of charts - bar charts (2D and 3D), stacked
bar charts, line charts, multi-line charts, points/symbols only and a hi-lo bar
chart. Control over all aspects of the graph elements - position, color, fonts, margins,
grid, and more - is provided. Images for background and for annotation stamps are also
supported.
While chart data is typically provided point by point by the user, gbChartMaster also allows the user to supply an equation which can be used to automatically generate the graph data.
The chart source code is written so that it can be easily inserted into PowerBASIC applications, so that other programmers can add the graphing capabilities to their own applications. The gbChartMaster application is essentially a demonstration of how to use the include source code in a PowerBASIC application, including how to use all 100+ available settings!
|
|
To install, just unzip the contents of the distribution file into a folder of its own!
Data Sets
Text/Colors/Font
Images
File Functions
Other
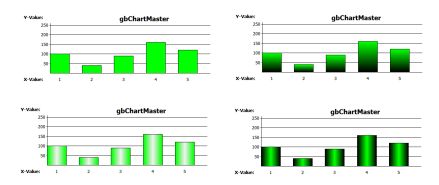
And, here are the bar gradient options.
And, here are the image/graphics options.

Also, gbChartMaster allows the user to put in an equation of the form y = f(x) and will generate the specified data points for the equation, as in this image:
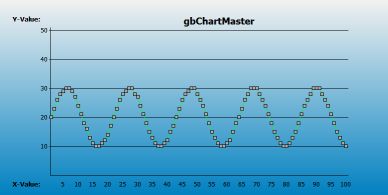
As you resize the dialog the graph will resize accordingly.
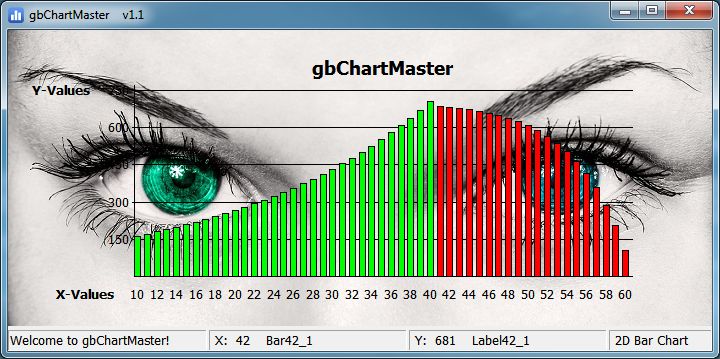
As you move the mouse over the graph, information about the bar under the mouse will be displayed in the statusbar. Point data is also available when moving the mouse below the plotted point.
Some mouse actions of interest:
To make changes to the chart, call up the Settings dialog with Ctrl-D, or just right click in an open area of the chart. When you close the graph dialog, the settings dialog will also close.
When you make a change in the Settings Dialog, the graph will change immediately. Changes are permanent, i.e., there is no "Save Changes" displayed when opening a new file or when closing the Settings dialog.
Likewise, whenever you select a change on the Settings Dialog, there is no "Are You Sure?" messages. So for such commands as "Reset", you'll want to look before you leap!
You'll want to experiment with the various settings to determine how to get the graph that displays a graph the way you want it to look. See the section above for several graph examples.

Each of the sections of the settings dialog is discussed below.
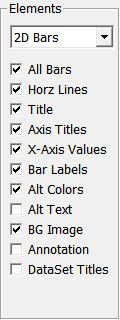
Elements:
Many of the graph elements are optional, as shown in the following image:
|
For each of the 3 data sets supported by gbChartMaster, there are 9 chart types available for graphing the data:
The 2/3 Line/Stacked charts, and the HiLo chart, use data from more than one data set to produce the chart. |
Titles
Charts contain several kinds of text, some for the entire chart and some that are
specific to each independent data set.
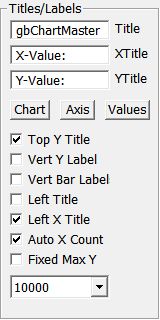 |
Text content, font and color of these text elements may be set by the user:
The first 3 items in this list can be entered as seen in the image to the left. The remainder of the text information can be entered independently for each data set - either programmatically or through the 'Data' section of the Settings dialog. Options are available for location of all chart and axis titles. The Y axis title and the bar labels can also be display vertically. Fonts may also be selected, one each for the chart title, axis titles and axis values. |
One important feature of gbChartMaster is its ability to manage how many data points are shown. When the number of data points charted is too many, the X-axis text values can overlap one another. The "Auto X Count" feature tells gbChartMaster to reduce the number of axis values that are displayed. Even with that feature on, the full number of labels can be shown (the "All Bars" selection from the elements image above).
gbChartMaster automatically detects the largest Y value to be graphed and selects a maximum Y value and sets Y divisions to be shown on the Y axis. The user can override that behavior with the "Fixed Max Y" to specify the maximum value to be shown on the Y axis, as well as to set the number of Y divisions used on the Y axis.
Colors
gbChartMasters allows the selection of colors - text, background, bars, lines, symbols.
It also support gradients on the background and on the bars. The entire chart, including the background, can be faded to white. Border colors for bars can also be specified. The image to the left shows the full range of color, fade and gradient settings.
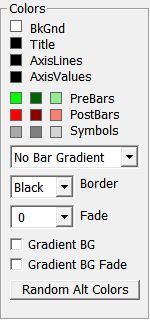 |
gbChartMaster supports using a different color for each bar/line segment. The colors
can be assigned by setting the color for each point in a data set. Or, chart bar/line colors
can be specified in one of two ways. A 'pivot' point on the X-axis may be defined, where all
data to the left ('PreBars') is graphed in one color and all data to the right ('PostBars') is
graphed in a second color.
The border of the bars may be set (white/black/none), the entire bar can be faded to white and the interior of each bar can be colored using one of the four gradient options. |
Drawing
These features of the graph are independent of each data set.
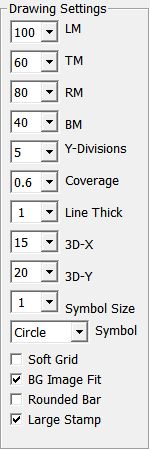 | The graph-level settings include the four margins, the number of divisions in the Y axis, width of the bars, line thickness, 3D XY depth, symbol type and size, grid color, and the size of an annotation stamp. |
Data
For the single data set graphs (2D, 3D, line, symbols), the gbChartMaster can switch
between datasets. Each data set has it's own Title, From/To/Pivot points, equation and data
points. All of these can be edited in the 'Data' section.

Pressing the 'Show Data' button will fill all 3 textboxes with the data from the currently selected data set.
Manual changes to the textbox content is automatically saved, but not applied to the graph until the 'Apply' buttons are pressed.
The Build Equation Data button fills the 'Data' textbox. The equation textbox consists of 5 parts:
Images
An application can incorporate images into a graph.
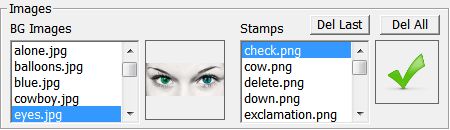
gbChartMaster demonstrates approaches to using an image as a background and to using small images as 'stamps' to be placed on the graph for annotation purposes.
Buttons
The buttons in this image are simply a collection of actions which the user may take.
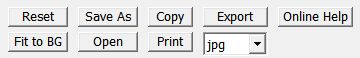
Reset completely removes the current 3 data sets, replacing them with a set of default data. There's no "Are you sure?", so be careful with it!
Charts may be saved to a file and later opened. The graph itself can be copied to the clipboard or saved as a jpg file (saved to the same location as the graph file).
Resizing the gbChartMaster dialog can result in the background image being drawn at other than its default aspect ratio. The 'Fit to BG' button will resize the height of the gbChartMaster dialog to ensure that the image is drawn to the image's natural aspect ratio.
The background images can be of any type (BMP/JPG/PNG/GIF).
The annotation stamp images are all of the same size - 128x128 - and may be displayed at full or half sized. Although any image type or size will work, small images with transparency (GIF/PNG) are best for overlaying on top of a graph.
As part of initialization, the main app passes the parent dialog handle, the graphic control handle and the graphic control DC to the chart settings. Additionally, initialization create the fonts needed by the gbChartMaster code.
The include file provides just two functions - DrawChart and DrawOneBar. It also provides the 3 custom types used by gbChartMaster - ChartData, ChartSettings and ChartPolyPoints. And finally, it provides some equates used by the two functions and by the parent application.
In gbChartMaster, the required array/variable are defined as Global, but there's no requirement for that from the code in the include file as the needed array/variable are passed to the functions in the include file functions as arguments.
The use of Global variables in the non-include file code was done simply for my convenience in writing the code.
The include file provides the minimum code needed to generate charts in your own custom application. By itself, the include file does not provide image (background and stamps) support. Example code for adding images to charts is provided in the gbChartMaster main source code file. Image support requires the use of Jose's includes. Without image support, the chart code does not require Jose's includes.
As now written, all chart X and Y values are LONG.