 gbVisualRetirement
 gbVisualRetirement is a free retirement planning tool which makes it very simple to
create a financial plan in just minutes. Wizards are available to help guide the user
through the steps of creating a basic or advanced financial plan, covering both pre-retirement
and post-retirement. Beginners and more experienced users will find
gbVisualRetirement easy to understand and use, but also very powerful in how
quickly it can be used to examine financial options. Financial plans are generated
in real time in response to user changes.
gbVisualRetirement is a free retirement planning tool which makes it very simple to
create a financial plan in just minutes. Wizards are available to help guide the user
through the steps of creating a basic or advanced financial plan, covering both pre-retirement
and post-retirement. Beginners and more experienced users will find
gbVisualRetirement easy to understand and use, but also very powerful in how
quickly it can be used to examine financial options. Financial plans are generated
in real time in response to user changes.
|
|
To install, just unzip the contents of the distribution file into a folder of its own! Then create a shortcut to the gbvisualretirement.exe file on the desktop, or where is convenient. To remove gbVisualRetirement just delete the installation folder.
Disclaimer:
Use at your own risk! While an honest attempt has been made to
ensure the accuracy of gbVisualRetirement you should always
consult a professional retirement planner when making critical
retirement financial decisions!

There are two types of financial plans supported, Basic and Advanced.
The Basic Plan is the easiest approach and uses a minimal set of financial inputs. The Basic Plan is used to provide quick overviews of impact of the factors involved in retirement - giving the user useful information without requiring excessive time to build the results.
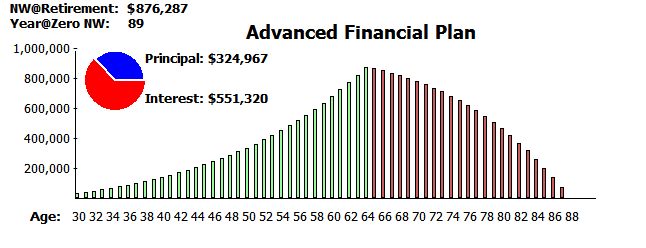
The Advanced Plan allows entry of a much wider range of financial information. While the output is the same for both plans (net worth graph), the greater level of detail is intended to provide greater assurance of the accuracy of the financial plan results.
Wizards are available which walk the user through providing inputs for the Basic and Advanced Financial plans. Wizards utilize default settings, based on user inputs, to speed up the process of creating a financial plan. Once the wizard is complete, the user can manually change the settings to tweak the results.
When I retired, analysis similar to that provided by gbVisualRetirement compared favorably (though with much less detail) to the results of the software utilized by my financial advisors. I consider gbVisualRetirement to be an excellent tool to use in getting familiar with retirement planning and especially as a tool to use before sitting down with your own financial advisor!
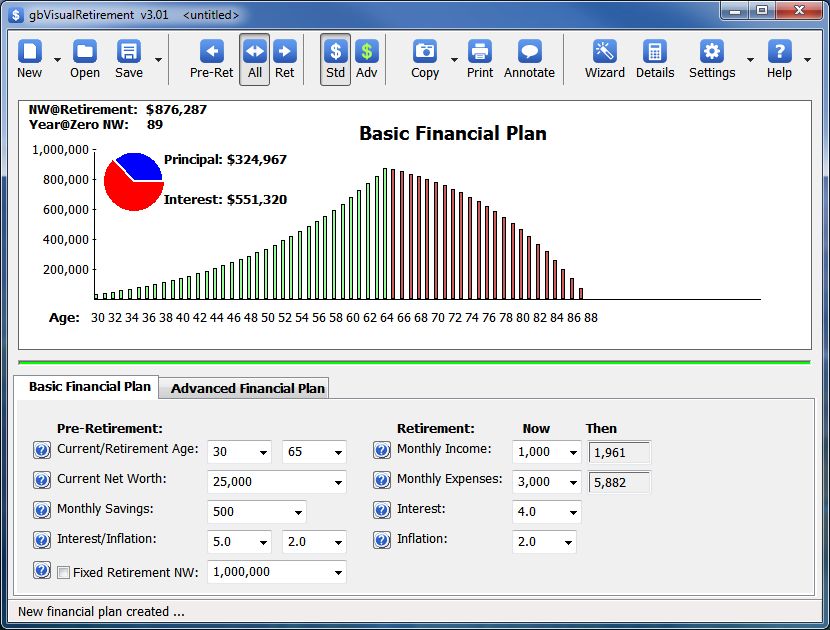
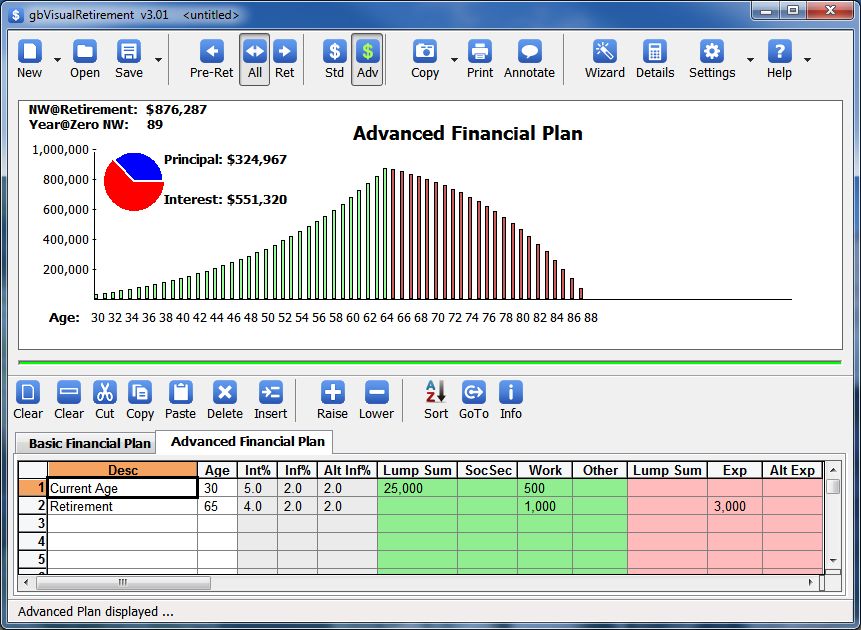
For both plans, however, the primary output is a graph showing net worth during pre-retirement and post-retirement years.
A financial plan file (*.pln) contains both the Basic and Advanced versions of the financial plans. The two plans can be modified independently of one another, but both are saved when the toolbar Save option is chosen.
The primary output of gbVisualRetirement is a graph which shows the user's net worth throughout pre-retirement (in green) and post-retirement (in red) through the age of 100.
Automatic Adjustments
By default, the graph is automatically redrawn to fit within the available
area. In particular, axis label values, bar widths and age span covered are
automatically optimized. The user may lock these values if desired.
The graph draws a bar for each age, but if the chart is sized too small for all ages to be shown without overlapping one another, the chart automatically skips printing of ages to ensure that printed ages can be read.
By default, the vertical chart values are sized so that the maximum net worth fits within the dimensions of the chart, ensuring that the graph is as large as possible. The maximum vertical axis value (net worth) can also be fixed, which may be less confusing than a chart whose maximum value shifts with changes in the input values or as the user resizes the main window.
Graph Content
Other than the graph itself (axis values and bars), content of the graph can be tailored
by the user. The graph can be limited to values from pre-retirement, retirement or both.
The annotation categories of retirement net worth, year at which net worth reaches zero,
the principal/interest accrued during pre-retirement and percent of net worth spend each
year are all optional. The age drawn in the graph can be limited to the age at which zero
net worth is reached, or 100 (the maximum age for which calculations are provided).
The chart can optionally include 4 annotations - NW@retirement, year@zero net worth, rate at which net worth is reduced during retirement and a pie chart of the principal and interest accrued during pre-retirement. A toolbar button is available to toggle display of annotations and menus are provided to fine tune which annotation elements are shown. The rate of reduction may optionally be replaced with the calendar year.
User Inputs
The following image shows the information the user specifies for
the Basic Financial Plan. Whenever a value is changed, the financial
graph is automatically updated. All values are entered as now year values.
Each of these setting values can be selected from dropdown lists. The wheel mouse may be used to move quickly through the values available to each setting. Just select one of the setting with the mouse, then use the wheel mouse to scroll up or down through the dropdown list. If you have manually entered a value that is not in the dropdown list, gbVisualRetirement will detect the appropriate next value to display when the wheel mouse is used.
Settings may also be manually typed into the fields. This allows entry of a value other than one found in the dropdown list. After typing in a value, pressing ENTER will update the financial graph.
Next are some comments about the pre-retirement inputs needed by the Basic Financial Model.
Retirement Inputs
Next are some comments about the post-retirement inputs needed by the Basic Financial Model.
Intermediate Calculations
The following intermediate calculated values, used in generating the net worth values for the Basic
Financial Plan, can optionally be displayed.
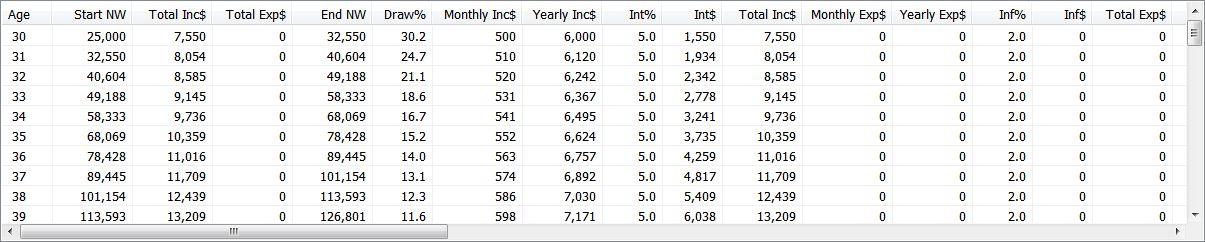
(click on the image to see a full size, readable version)
A user may occasionally want to review the intermediate values for each year to determine what then-year values have been used by the plan.
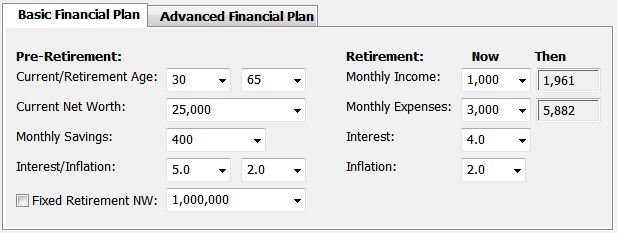
Here's a close up image of just the Advanced Financial Plan input section:
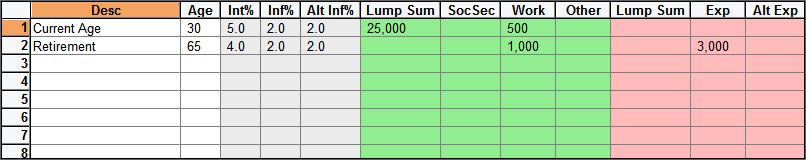
The Advanced Financial Plan allows up to 100 lines of input, where each line consists of a description and the age at which the additional (optional) 10 inputs on the line become effective.
Here's a description of the parameters found on each input line. One or more input values can be assigned to any input line.
The Advanced Financial Plan input lines can be placed in any order. gbVisualRetirement always sorts the lines by age before using them to generate results.
Persistent Inputs
When an Advanced Financial Plan monthly input is entered, the input continues to apply in all
subsequent months/years until explicitly changed by another input line. For example, in the following
excerpt from the input image above ...
   Desc      Age  Int%
Current Age   30   5.0
Retirement    65   4.0
The interest rate of 5.0 applies for years 30-64. The interest rate of 4.0 applies for years 65-100 (100 is the maximum year of both the Basic and Advanced retirement plans).
Yearly Inputs
Lump Sum inputs (income or expense) are yearly values and apply only to the year
specified by the Age on the input line
Required Input Lines
There is a minimum of 2 lines required for the Advanced Financial Plan inputs. One
line must have a description of "Current Age", "Now", or "Today". The Age on that
line is considered to be the starting age of the Advanced Financial Plan.
A second line must have the description of "Retire" or "Retirement". The Age on that line is considered to be the retirement age of the Advanced Financial Plan.
Toolbar for Advanced Financial Plan Inputs
The following toolbar allows actions to be taken on the plan rows and cells:

Many of the toolbar functions are also conveniently available via the plan context menu.
Intermediate Calculations
The following intermediate calculated values, used in generating the net worth values for the Advanced
Financial Plan, can optionally be displayed.

(click on the image to see a full size, readable version)
A user may occasionally want to review the intermediate values for each year to determine what then-year values have been used by the plan.
In the Intermediate Calculations you'll see headers which start with nm, ny, tm and ty. These are just shortcuts for "Now Monthly", "Now Yearly", "Then Monthly", "Then Yearly". The shortcuts are used just to keep the header widths to a minimum.

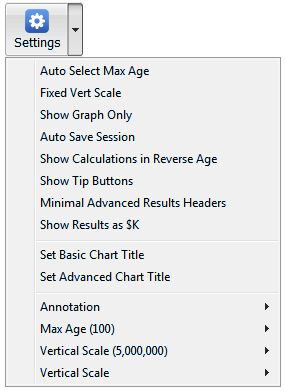
The dropdown menus provides additional options ...
The dropdown menus provides additional options ...
The dropdown menus provides additional options ...
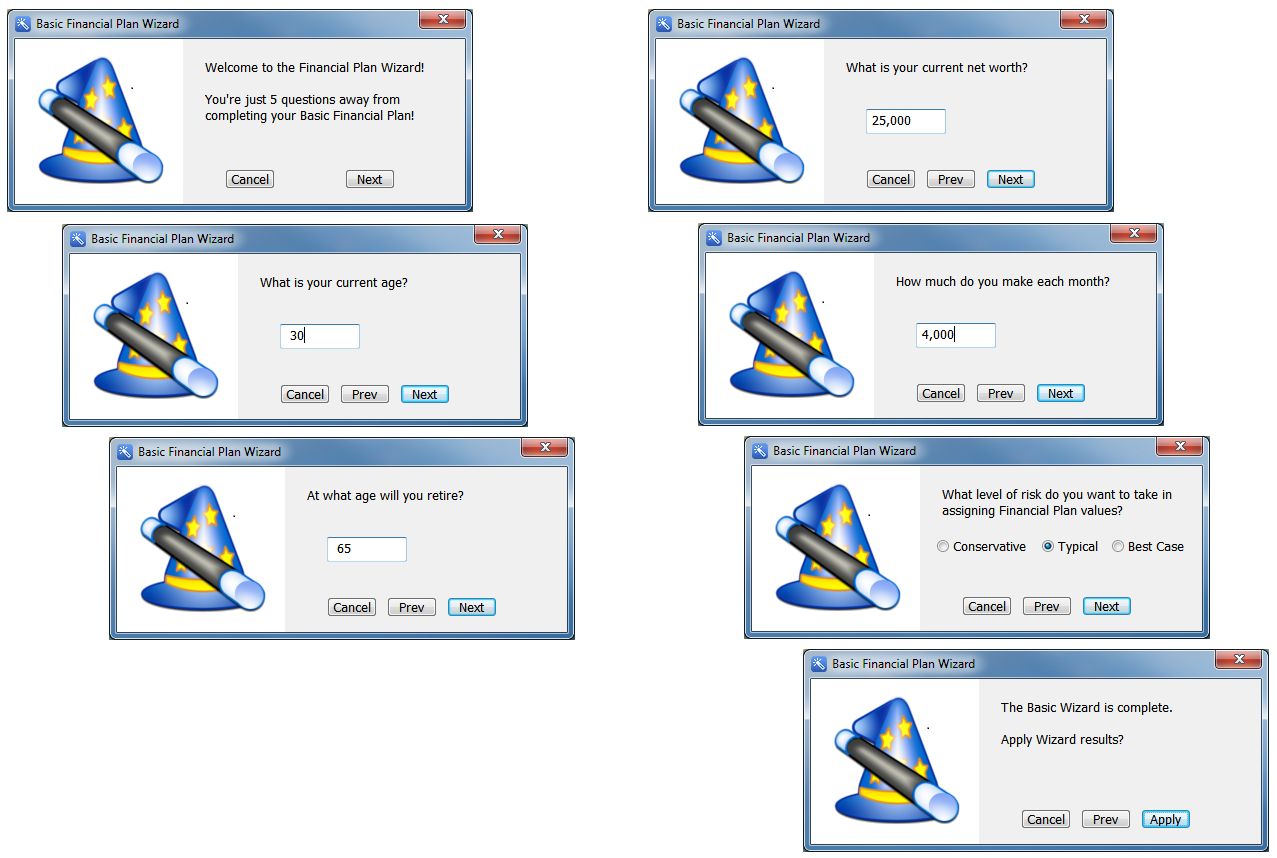
The Basic Wizard walks the user through the necessary inputs in just 5 questions.
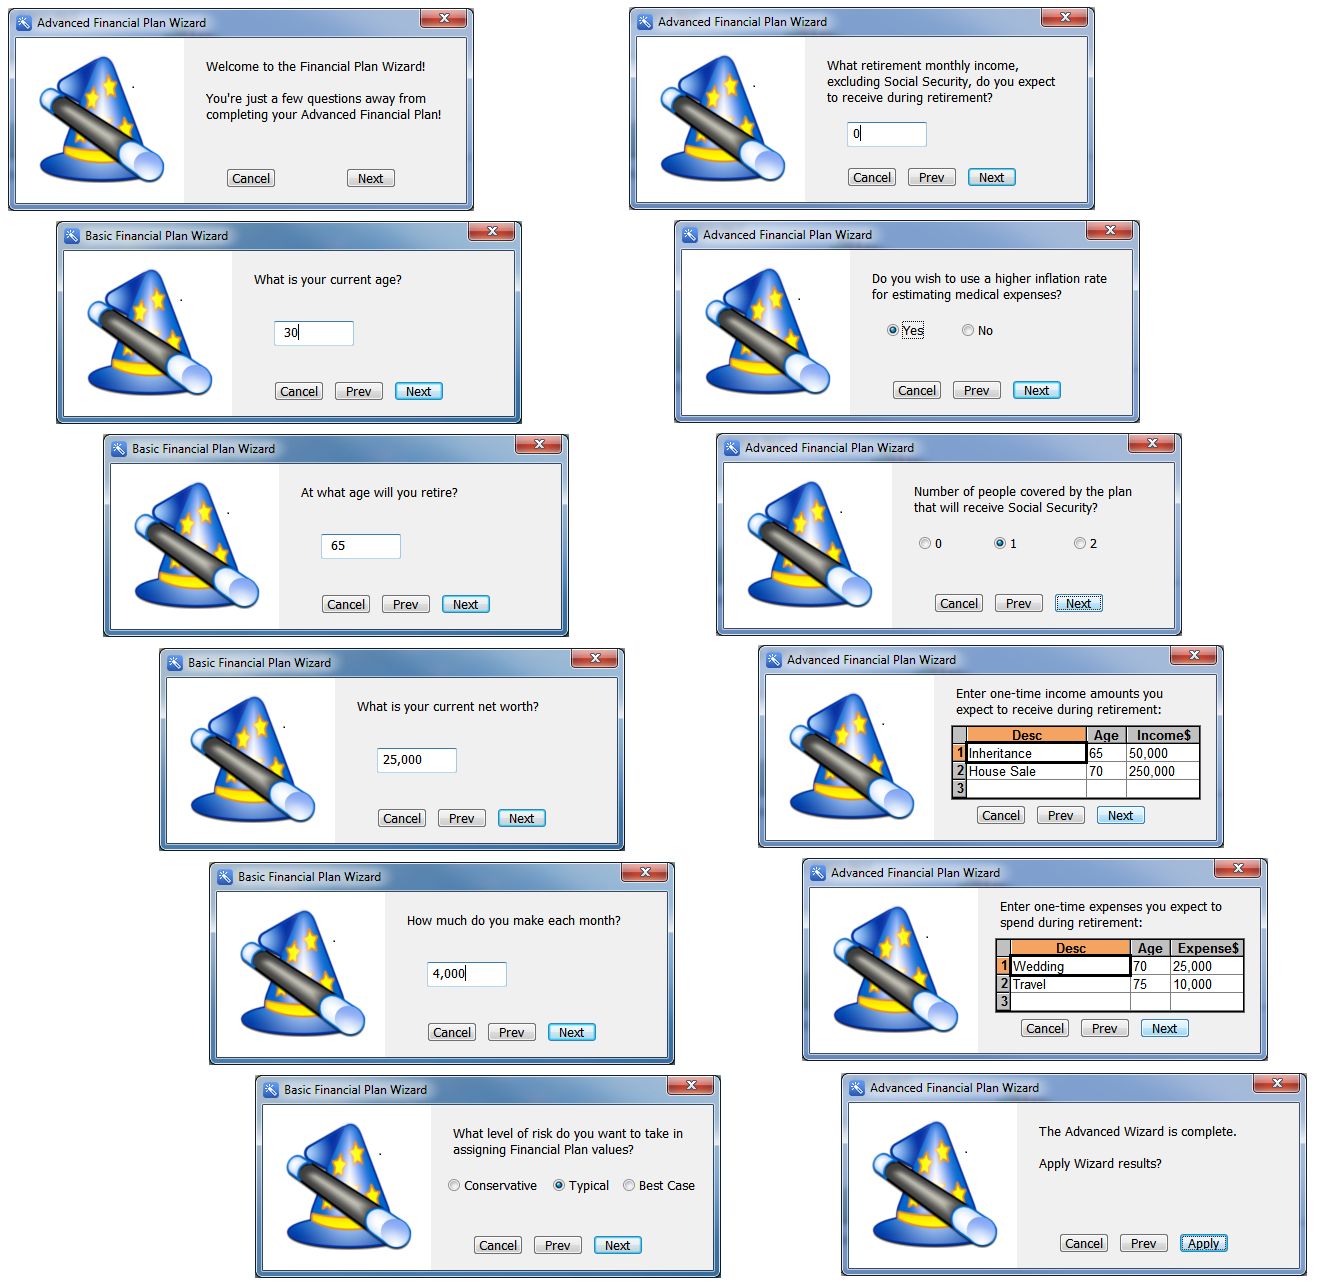
The Advanced Wizard walks the user through the necessary inputs in just 10 questions.
| Pre-Retirement | Post-Retirement | |||||||||
| Risk | Int | Inf | Alt-Inf | Savings | Int | Inf | Alt-Inf | SocSec | Exp | Alt-Exp |
| Conservative | 4.0 | 3.0 | 6.0 | 10% | 2.0 | 3.0 | 6.0 | $800/person | 90% | 30% |
| Typical | 5.0 | 3.0 | 6.0 | 15% | 4.0 | 3.0 | 6.0 | $1000/person | 85% | 25% |
| Best Case | 6.0 | 3.0 | 6.0 | 20% | 6.0 | 3.0 | 6.0 | $1200/person | 70% | 20% |
Notes:
One of the questions in the Wizard is how many people are included in the plan. That allows
the setting to be multiplied by the per person Social Security defaults given in the table.
Another question is how much monthly income does the user make. The Savings percentages in the table are applied to that value to determine pre-retirement savings.
Post-retirement expenses are estimated as a percentage of the pre-retirement expenses.
Finally, post-retirement alternate expenses (those which use a higher inflation value) are estimated as a percentage of the post-retirement expenses.